
Machine Learning tools are quickly becoming a more and more crucial tool in every business’s tool belt. Here’s more detail on some of ways I’ve worked with various kinds of ML. Some of it is a bit technical, so if you just want examples of how I’ve used data science to help clients – check out my Data Science, Pipelining, and Tools page.
Impact measurement
Principles
Cookie-based tracking and attribution alone isn’t enough for us to know how marketing activity is impacting the bottom line. To be able to understand what’s actually working and what’s not – it’s more and more important to be able to use Machine Learning tools to measure marketing impact in a mathematical way.
I have run incrementality testing at multiple companies, both personally, directly with clients, and by creating frameworks so that teams can run multiple tests independently. My testing programs have a particular focus on:
|
|
A well defined change, ideally rolled out over a short period of time to help the test reach confidence quickly (more gradual tests can be possible but they are much riskier in terms of company buy-in so they aren’t the first go-to). |
|
|
A testing hypothesis for why we think the change could have a significant effect, and if we expect there to be a lag between our change and any impact on the metric we’re trying to affect. |
|
|
A clear idea of confounding factors – for example whether there could be other changes around the same time that might change the results. |
|
|
Making sure we’re not accidentally adding data that could influence the result, or cause the model to overfit on patterns (this can be particularly easy in PPC, for example using “spend” as a feature in our data when we’re trying to measure revenue, because often spend is affected by number of conversions in a day). |
|
|
Agreement about whether the metric we’re measuring is the business impact, or whether it’s just something that we think will help create business impact. Sometimes it’s not possible to measure the thing we really want to – but that leaves the possibility that we improve our measured metric while harming the real thing we want to affect. |
Finding over > £100K of wasted spend for an ecommerce client
To test how much advertising was actually doing for an ecommerce client – I worked with them to turn off key campaigns and measure the impact, factoring in seasonality and trends.
The client’s business is heavily seasonal, so we ran the test over as calm a period as possible and used Causal Impact with regressors to highlight any important patterns that should be factored into the model.
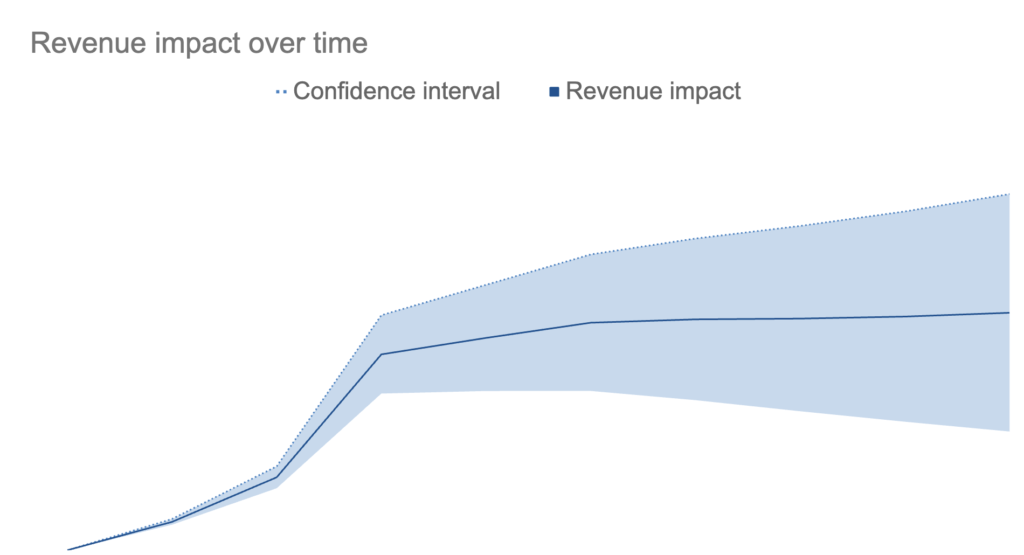
By comparing actual revenue to forecast, we found a steady drop-off over around 5 days before everything levelled out. That helped us come up with some new ideas about how long customers were taking to convert after seeing ads (considerably longer than the business thought).
We could also see that the revenue impact seemed considerably lower than ads platforms were reporting, so we highlighted around £100K of spend as potentially wasted, and earmarked it for future testing.
Code
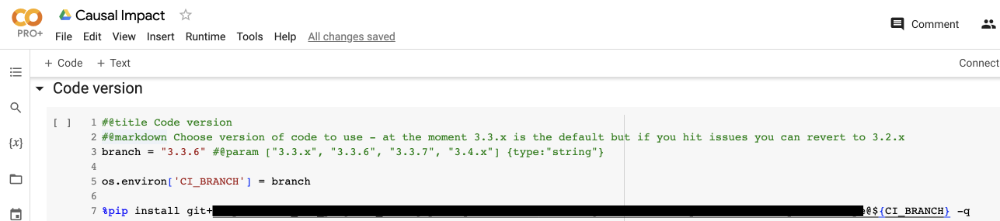
I find the easiest tools to use for impact testing are Causal Impact and facebooks Geolift library.
When I’m running testing plans with code-savvy teams (or just by myself) I make sure everything is consistent and easily maintainable by hosting it all in a private repo.
From there, we can run everything in Colab notebooks because they offer a cheap, flexible, robust environment, with a tight feedback loop.
I describe an early version of this “best of both worlds” process in A better way to get your team using Python.
Forecasting
The tension between accuracy and reality
As hard as it is to measure impact – it’s even harder to accurately forecast what we should expect in the future. But businesses have to have some idea of what will happen over the next year (or three) to be able to make plans.
Forecasting comes down to that fundamental tension, between businesses needing some answers, and specialists knowing all the ways in which those answers might be wrong.
To me – effective forecasting is partially a machine learning problem, partially a communications problem (which some common machine learning tools can often help with).
I’ve worked with teams to forecast performance, and also to roll out forecasting tools and processes. But I think that the way we think about forecasting is actually more important than the code itself. So here are some examples of how I think about forecasting.
Visualising uncertainty
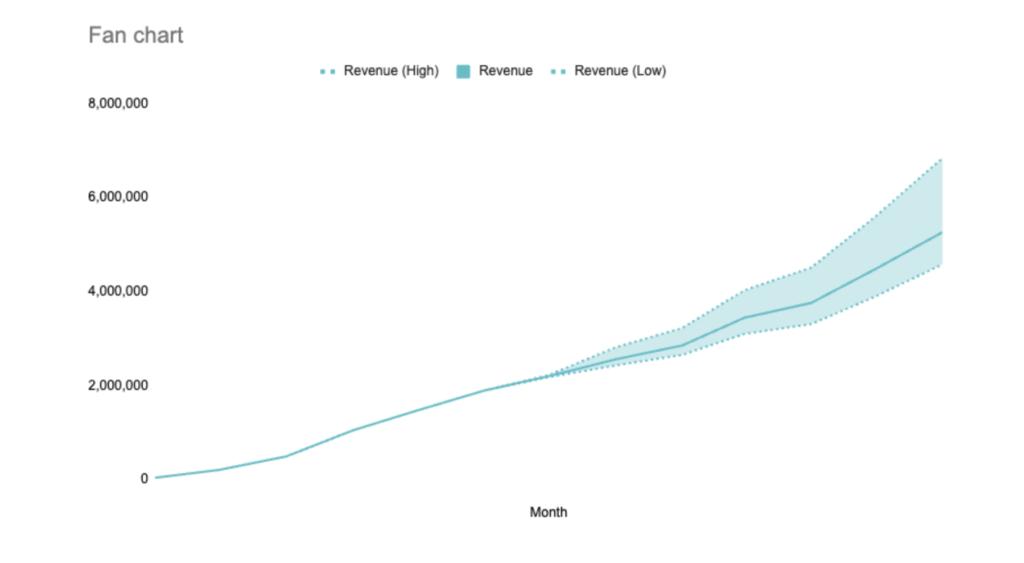
As I explain in this blog post – I think one of the benefits of machine learning forecasting tools is they tend to give us visualisations that help people think in the right way.
For example – even if we ignore the calculations used to get us forecasts, fan charts (like the one here) help communicate that the future isn’t certain, and could include a range of possibilities.
Unfortunately, fan charts are usually quite hard to produce, which is why I worked with my team to create a Google Sheets template and plugin, which creates fan charts for people.
Combining maths with expert knowledge
Maths-based forecasting tools are often great at understanding the interactions between different effects in the past, and can give us a real shortcut to factoring in things like seasonality in the future.
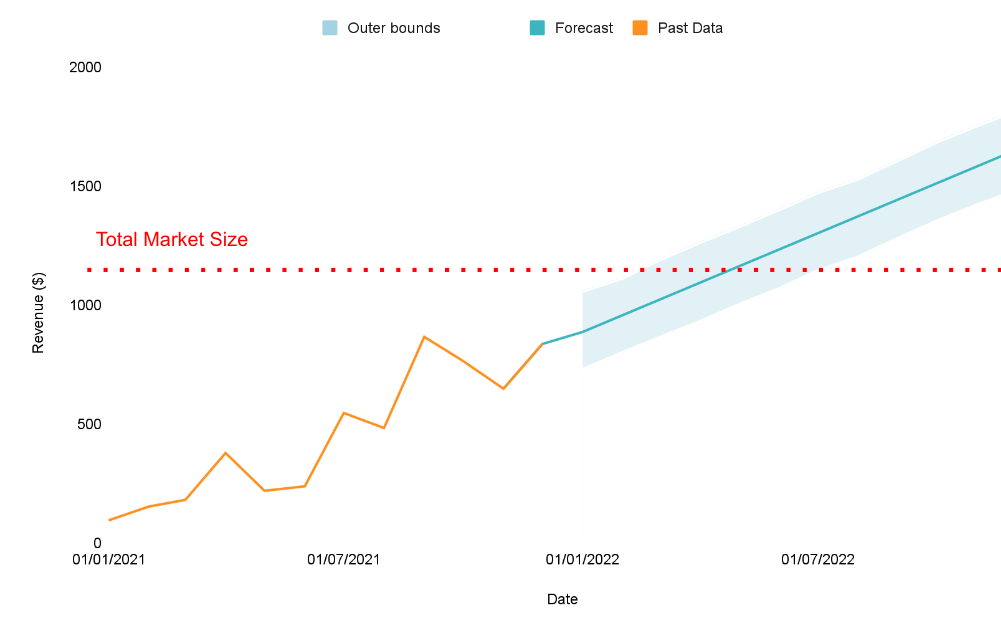
A caricature of the kind of over-simplified thinking we need to avoid –
logistic models can help but can end up dampening seasonality more aggressively than they change the trend.
Unfortunately, most of the time when we’re running a forecast we’re expecting something to change, because we know information about our plans that the model cannot. Sometimes we can represent that with smart choices in regressors, but often there’s no historical precedent.
The solution I’ve worked on with colleagues at Aira is to use maths-based forecasting tools to identify seasonal patterns and trend, to put all of that data in a spreadsheet and then use Excel formulas to let experts choose how much they want to trust the trend. Then, from that baseline – we layer on expected performance changes based on our plan.
As well as giving us more fine-grained control over forecasts, this helps reduce “automation bias”.
Code
For forecasting, my go-to tools are often Prophet, or if non-coders need to be able. touse the tool without help, Forecast Forge.
As with other coding projects – I make sure that our toolkit is all kept in a private repo and referenced in Colab or Jupyter notebooks, usually relying on custom APIs I’ve built to automatically save data in Sheets files.
Using ML tools that aren’t out-of-the-box
Principles
My rule of thumb with data science projects is to start with what’s already been built and to switch to building your own when you’ve confirmed the out-of-the-box tools won’t help. It often means that I and my teams can get benchmarking results faster, to improve on, and we end up with a better understanding of why certain choices are important (and which answers we should just copy).
That said, sometimes the tools aren’t enough, and building your own can be a valuable way to understand what’s going on.
Recreating k-means clustering
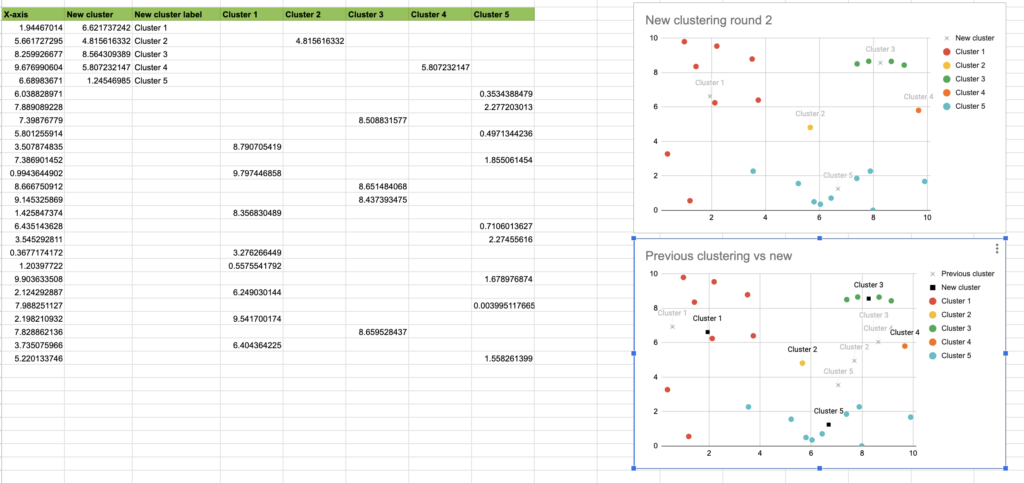
Often a great way to properly understand something is to try to teach someone else.
A few years ago, to better understand k-means clustering, I put together a blog post which breaks down the process step-by-step and gives readers a way to do it in Python, or to go through the first few steps with some simple gsheets formulas.
Estimating Co2 pollution in Rwanda
While much of my actual code is private IP, I have taken on some public projects as a way to test my skills. For example here’s a gist of code I used to try to forecast Co2 levels in Rwanda, as part of a competition to help the country understand how they are contributing to climate change.
The project required feature cleaning and standardisation, synthetic feature creation, time series forecasting and combining patterns from multiple potential features. I used a combination of Prophet and XGBoost as a way to forecast the time series and make predictions across multiple locations.
Vector databases and smarter LLMs
A new frontier
Large Language Models are an incredibly powerful tool, becoming a bigger and bigger part of our working lives. But they do have a couple limitations – for one, it can be hard to integrate private data, which means that getting them to give answers which are accurate (and relevant to your business) might seem impossible.
A supercharged LLM based on internal data

I’ve been working with Aira to develop Super Search (“Soos”), an integrated LLM and vector database tool which pulls in data from client files and communications, surfaces the most relevant information, and lets consultants ask direct questions, or just sense-check an email they are about to send.
Soos is currently in Beta but we’ll be sharing more soon.