Brand performance can have a big impact on our success as marketers. I’ve written about why SEOs in particular should care about brand here on Search Engine Land. But I think it’s wise for us all to pay attention to this topic.
The difficulty with measuring brand performance
The problem is, brand performance (which I’ll just refer to as “brand” from now on) can be very difficult to measure. There aren’t many sources of data that will do the trick.
Sure, we can use things like surveys to get an idea of how well some people are recalling our brand. That can work particularly well for measuring the success of individual paid campaigns within a platform but with surveys;
- We can’t ask everyone so we’re missing a lot of data
- It takes time and money to get the results
- As academics have said for years we can’t always trust what people self-report.
So to get a more complete picture of brand strength we really need non-survey data.
One option is to measure how often people are searching for our brand.
If we only care about our own brand performance over time we could use Search Console data. If we see the number of impressions for our brand going up then we’re probably doing better, if it’s going down then we’re probably doing worse. But to take action we ideally need to be able to compare interest in our brand with interest in our competitors’ brands. Search Console can’t help us with this because we only see data for terms we are ranking for.
Normally we could get search volume data from third party tools like SEMRush or Moz. The problem is those tools tend to give one overall search volume number for a whole country. But brand awareness can differs from city to city. Having lots of interested customers in New York is not the same as having lots of interested customers in Seattle.
So we need a different source of data if we want to answer questions like “where is my brand weak in comparison with my competitors?”
Why Google Trends is great for measuring brand
Google Trends;
- Is free
- It lets us compare interest for different terms (and therefore different brands). We don’t have to rank for all the terms we’re comparing.
- Gives us historic data for the last 15 years as soon as we ask for it
- Lets us break down that data at state, metro, or city level.
How to use Google Trends historic data to get brand insight
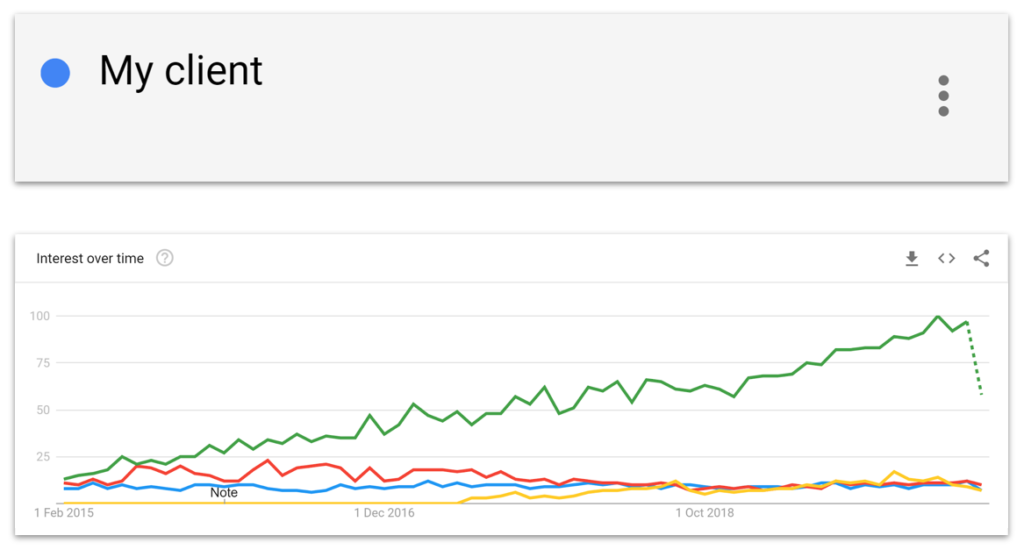
The graph below shows searches in India for my client and their competitors over the last 15 years. Before looking at this I had no idea what their industry was like in India, certainly not fifteen years ago. By simply tracking the number of searches for these brands we can get a idea of what has happened to the industry over time.
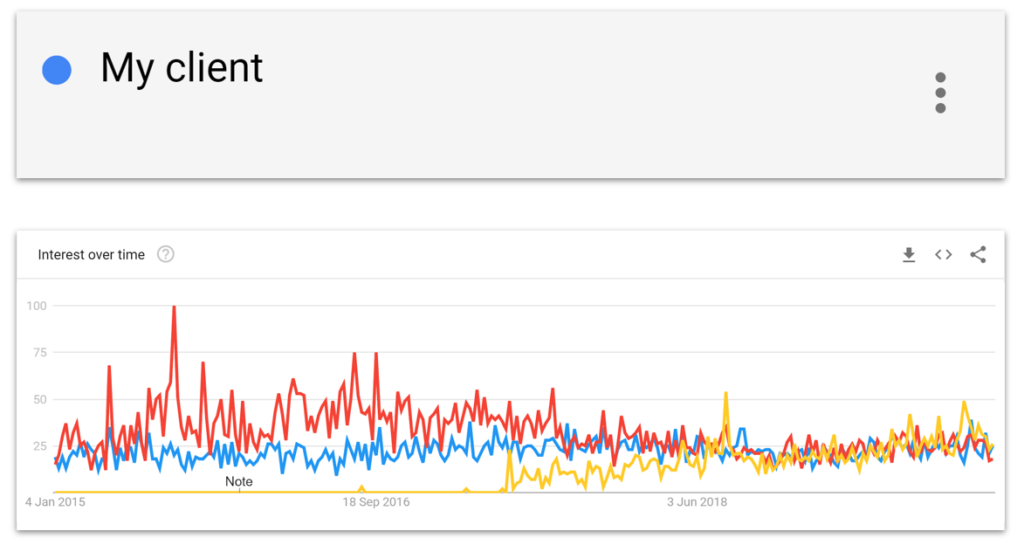
For example;
- The competitor in red was way in the lead but lost that lead over time
- My client has had good years and bad years but has actually stayed fairly static overall
- The competitor in yellow has gone from nothing, to pretty much leading the pack.
These insights can tell us what happened. Even better, by zooming in on specific changes in the graph, we can start come up with ideas for why changes happened.
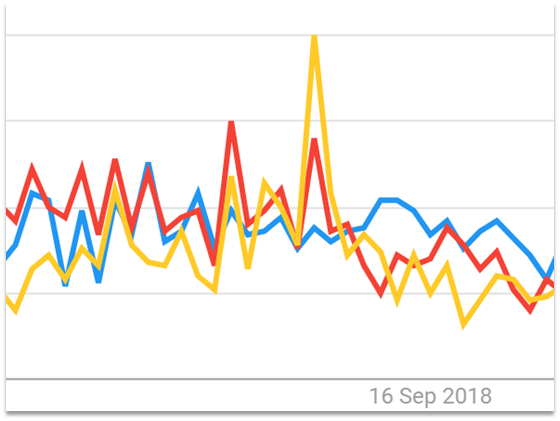
For example – the yellow spike below coincides with an influencer-led conference that one of our competitors ran. It got a fair amount of press attention and seemed successful.
But as you see, the searches for their brand dropped off again after that spike.
Later on, the same competitor started running smaller, regular events across the country. Meetups targeting their core customer base, using influencers and contacts they worked with for their bigger initial event. While they were doing that, they had a steady rise in branded searches until they were overtaking everyone else.
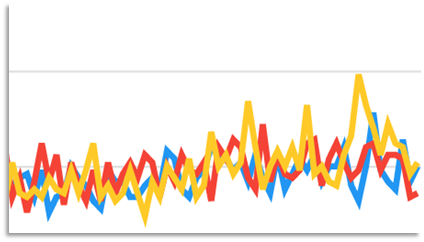
This kind of pattern is a key part of informing a strategy. We can use it to see what activity might be working for us or for competitors. For example, here we could plan to support our large conference marketing with smaller ongoing events.
That’s also not the only application;
How Google Trends historic data can help with site migrations
Imagine you have just rebranded. That means you’ll definitely need to migrate from one site to another.
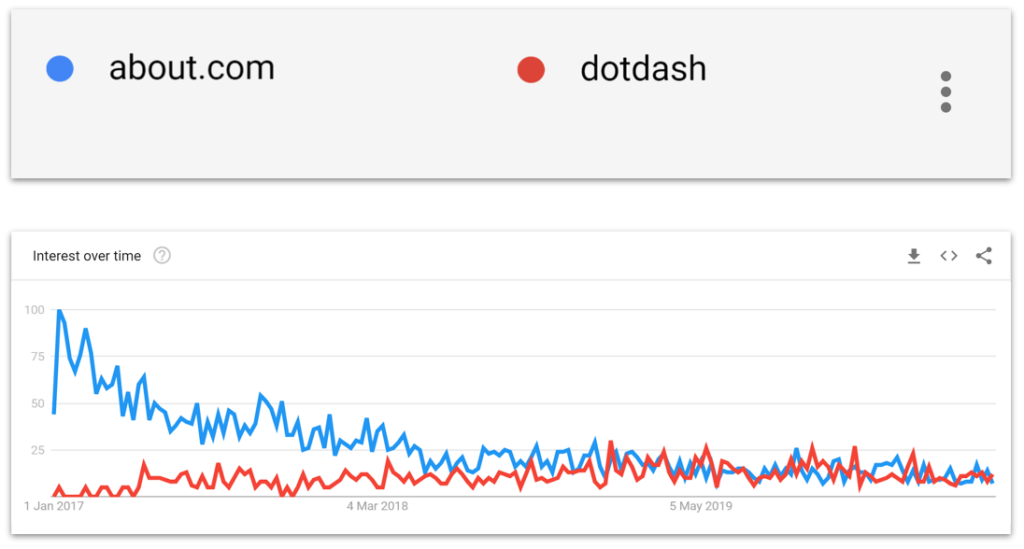
If you’re in charge of SEO, people will be coming to you asking where your organic traffic has gone. It can make a huge difference to be able to point to a graph like the one below and show that, aside from any technical issues you’ve steadily lost brand interest and that’s a component of your traffic.
We often talk about a site migration taking months to stabilise. A botched brand migration could take years to stabilise and cost us traffic all the while.
How to use the territory breakdown to get brand insight
Sometimes when we’re looking at brand interest we can’t just point to specific activities that made the difference. Sometimes someone is just smashing it, and has been for some time.
The below graph shows searches for my client and those same competitors in India. But now we’ve added in the green competitor and they are doing really well.
When faced with a dominant competitor like this one that seems insurmountable, how can we be more tactical than just saying “get better known in India” to chip away at their lead?
Make tactical brand decisions with Google Trends maps
Google Trends will also show you proportions of searches broken down by territory. For example, out of all the searches for these four brands in Maharashtra – 75% are for the green competitor.
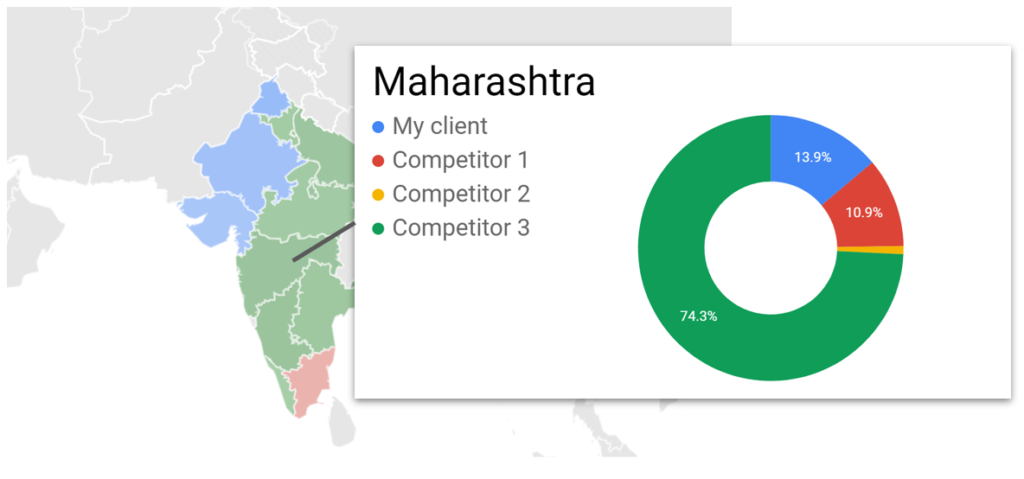
That shows us that we would have a lot of work to do, to achieve brand dominance in Maharashtra.
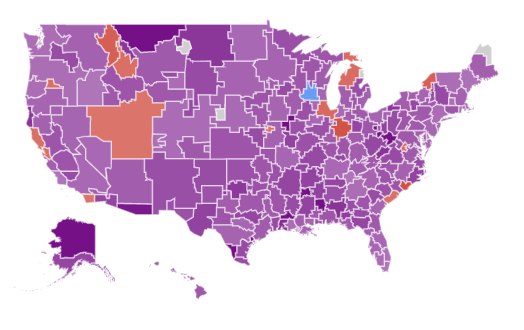
Depending on the country we can also see this brand awareness data broken down by territory.
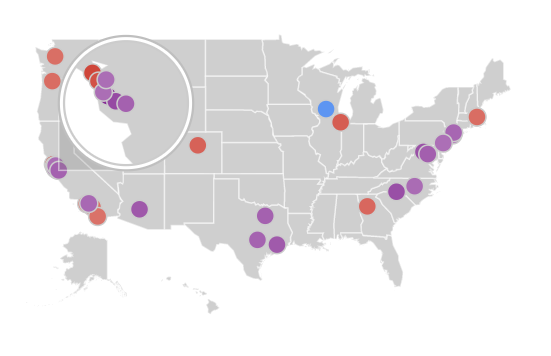
And city-level brand interest too.
But not every territory is equally valuable. We could know that a competitor is very strong in a specific area but maybe there are hardly any people in that territory who would buy our product. In that case we wouldn’t want to put in all the hard work we’d need to build up our brand there.
How do we identify which territories are worth investing in?
Combine Trends data with census data
Census data is an absolute goldmine. Most countries make it available in some form. They’ll give you number of businesses broken down by location, size, and industry (great for reaching B2B audiences). They’ll give you number of people by city, age, and demographic (great for B2C marketing). If you know who your audience is, you can use census data to see which territories are valuable.
As an example, here’s the US census site. It even has an awesome pivot table generator that lets you add and remove dimensions as you please.
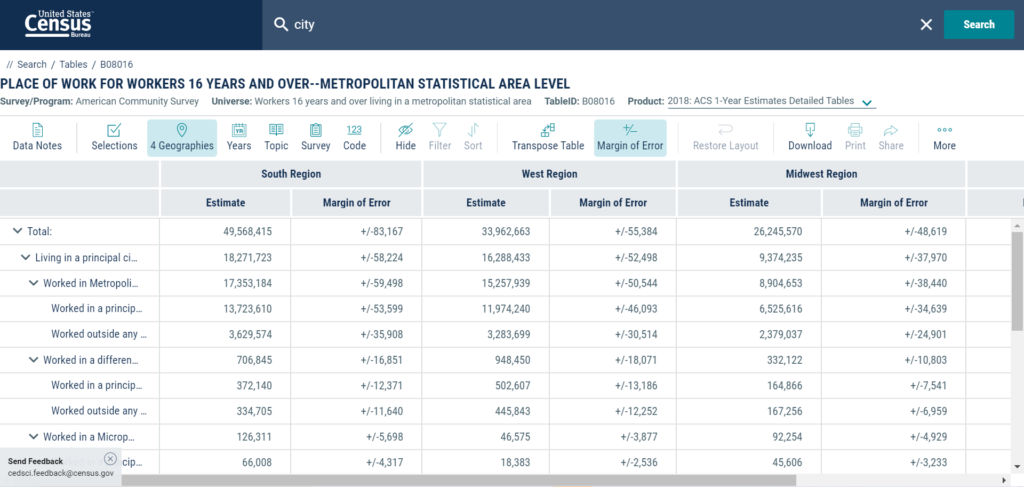
By combining census data with data from Google Trends, we get an idea of which territories are driving the most value for us and our competitors. It can be as simple as
Number of customers in territory * Our Google Trends % for territory =
Value of territory for us
Number of customers in territory * Competitor 1 Google Trends % for territory =
Value of territory for competitor 1
Number of customers in territory * Competitor 2 Google Trends % for territory =
Value of territory for competitor 2
And so on.
A case study
For example, we were working with my client in India and it looked like Bangalore was a key territory.
Google Trends showed us that one competitor was really strong there and had been strong for a long time. In fact this competitor they had their global headquarters there. So it would take a lot of effort to unseat them.
What’s more, based on census data, the number of actual relevant businesses in Bangalore was relatively low. So return on investment after all that hard work wouldn’t be great.

Now Mumbai on the other hand – that same competitor was growing, but they haven’t always been strong there. And based on census data there were loads of relevant businesses there.
In fact, there were a bunch of relevant medium-sized businesses there and our client caters really well to medium-sized businesses.

That information opened up a lot of options for us. We could use it to;
- Plan a bunch of ads, targeting Mumbai, where we made it clear that our competitors aren’t as well suited for medium-sized businesses
- See what people are talking about on social media, and what press are writing about in Mumbai. Use that to guide our content
- Use that content to rank and generate traffic. But not any old traffic, relevant traffic that’s drives sales and increases brand awareness in a key territory
- Push that same content out on social media and to press in Mumbai. We know we’ll get more interaction, coverage, and links because we’re targeting the topics they are interested in.
That’s traffic generating interest, which gets links, which drive traffic, which changes minds which gets sales.
What isn’t great about Google Trends
Google Trends isn’t perfect, it does have drawbacks;
1. We don’t get absolute data
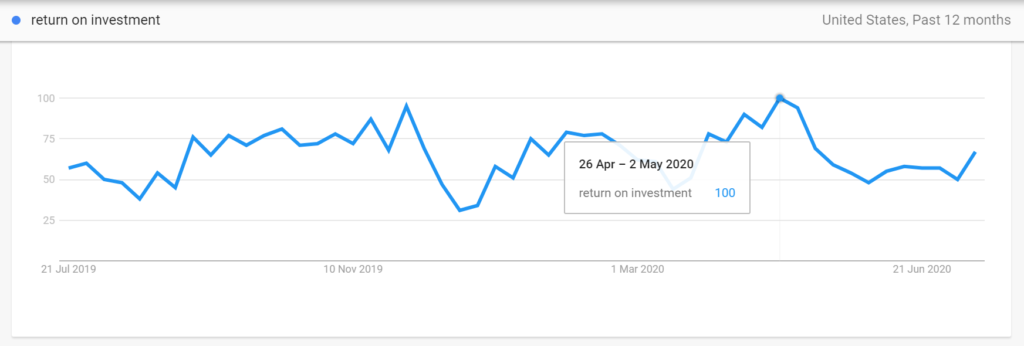
Trends gives us everything as proportions out of a hundred. We can combine it with census data to try to estimate audience sizes (as per the formula above). But we don’t know exactly how many people are searching for something, so it’s harder to know what return on investment we’ll get. (You can get actual numbers using the Google Ads method I describe in this other post.)
2. Accuracy could be improved
If search volumes are quite low then results become less accurate. There’s a level of sampling involved (as is often the case with free tools). However – I have a way to improve that. Check out my how to make Google Trends more accurate section below.
3. Missing data
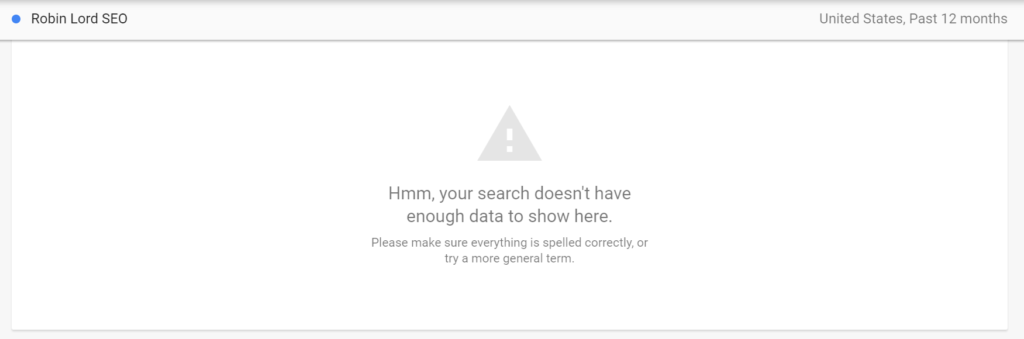
If we try to get data about terms with very low search volumes then Trends won’t give us any data at all. That becomes particularly problematic if we are looking at smaller brands or if we want to get product-level brand insight.
If this is a problem for you then check out my guide to getting brand data from Google Ads.
4. Reliance on Google
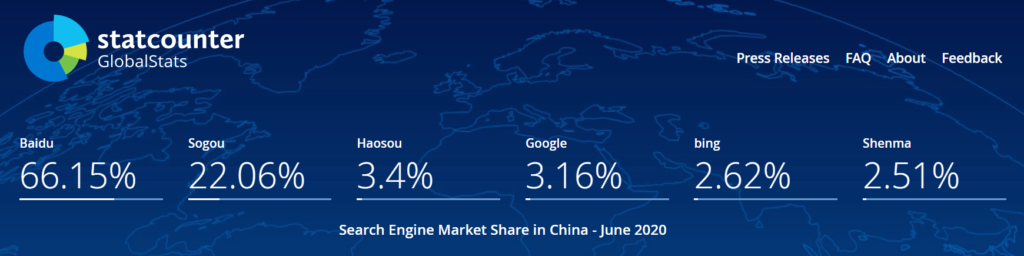
Because Google Trends shows us how often people search for something in Google we are relying on most people using Google. Fortunately that’s not a problem in most countries because Google is by far the most used search engine.
However, in China for example, only about 3% of people use Google. As it happens, the leading search engine in China, Baidu, has its own version of Google Trends. Baidu Trends is, in many ways, superior to Google Trends. I’m going to write about that soon but this post is long enough as it is.
How to make Google Trends more accurate
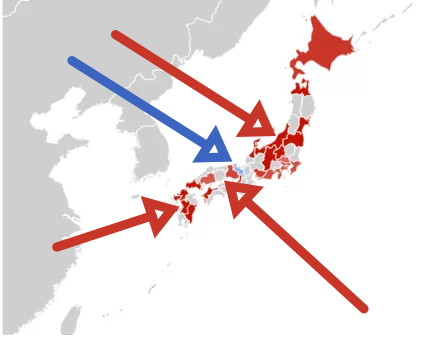
The below (kind of rubbish) spot-the-difference comes from asking Google Trends about the same set of low search volume terms, over the same time period in Japan. The results should be identical. But we’ve left about half an hour between requests and some of the prefectures in Japan are showing different results.
Given that we’re using this data to direct brand investment you could find it deeply disturbing that the picture changed. But this is actually really good for us.

Understandably, when we load up this free tool and ask about five search terms, Google is not poring through every one of the the millions of searches across the country and getting us a perfect, territory-level breakdown in 30 seconds. Google is taking a sample of searches and getting our results based on that sample.
Normally we wouldn’t be able do anything about something like that. We’d just have to put up with data that’s less accurate. However, because we get different data every 30 minutes we can just ask the same question a few times with about half an hour between requests. Then we can take the data we get back and create our own visualisation.
Making our own brand-strength chart
Below is one of the visualisations I created working with this data. I asked Trends about searches for five different brand terms in Japan in 2018. I asked the same question about 25 times, each time with at least half an hour between requests, and plotted the answers on the box chart below.
You might recognise the colours. We can interpret this in just the same way as we do Google Trends – where red is at the top, the red competitor is owning that prefecture.
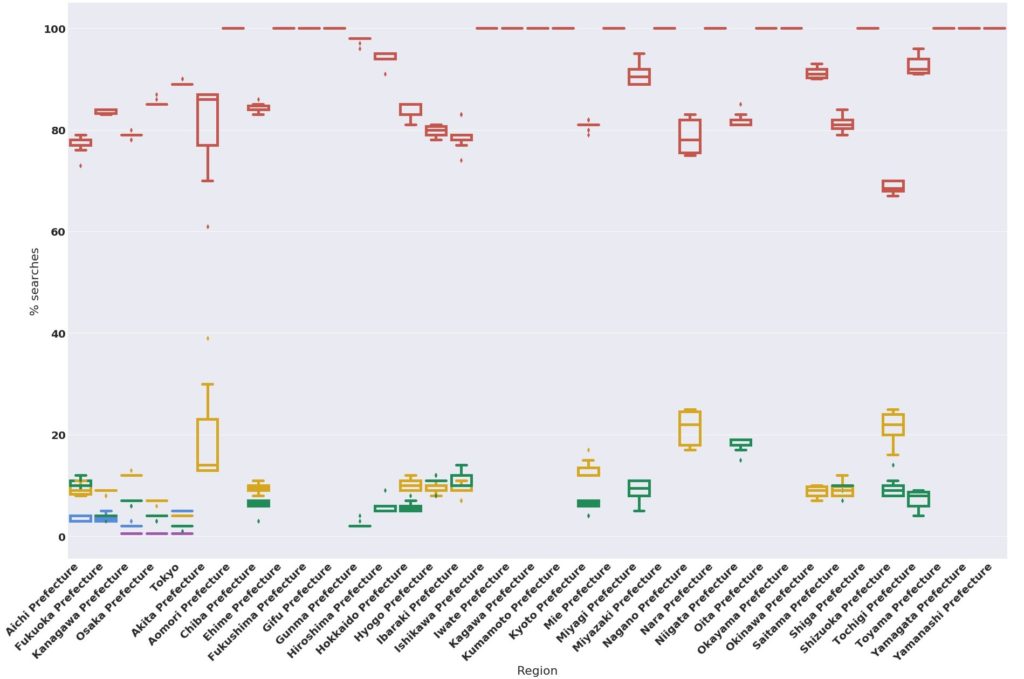
The boxes on the chart show the mean values, percentiles, and absolute minimum and maximum values I got for each term in each territory. Where the boxes are biggest that means the results we are getting back change the most between each request. The bigger the box, the less we trust the data. We trust the data least if the boxes for different competitors are overlapping (like they are in Ibaraki prefecture).
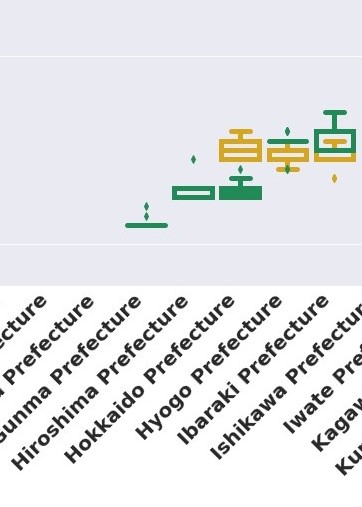
Usually the places where we get the biggest boxes and least accurate data are the smallest states, territories, or prefectures. Basically wherever the search volumes are low. That suggests that Google is first sampling this data at country-level before then splitting up the results into the individual territories.
This works out for us if we’re combining Trends data with census data. We use the census data to help us focus on territories where most of our customers are. Territories where there are more customers are territories where there will be more searches. So we usually end up focusing on places where the data is most accurate anyway.
But you don’t really need to know all of that. What you need to know is the data is changing between requests but overall the rankings between brands is pretty consistent. There aren’t many places where we’re not certain if competitor A is doing better or competitor B is. If we see the boxes for different competitors overlapping then we need to be sceptical of that data.
Google Trends is a powerful source of brand data
Google Trends is a massively underused source of insight and can really help us plan, and measure brand activity. If you need more fine-grained information then check out my post on using Google Ads to get brand data.
In the meantime, I’d love to hear from you. Is there something I’ve missed? Have you found even better sources of brand insight? Drop me a comment below or tweet me @robinlord8.