This is a way of getting highly granular brand strength comparisons out of Google Ads.
Using this approach, you can compare the brand strength of your company and your competitors at city and product level. I’ll go into this in more detail below, but we can use this data to come to conclusions like;
- Users could be struggling with the UX of zara.com – we should run UX surveys
- Zara should run “maternity” adverts and events in Vancouver to capitalise on high interest
- J.Crew should develop “plus size” category pages, sponsor CurvyCon and run more “plus size” Facebook ads.
Other reading
I’ve written about how to get free, immediate brand strength data from Google Trends. If you’re interested in this method, I really recommend using this process alongside my Google Trends idea.
If you’re an SEO and you don’t think you should care about brand performance, or be part of brand decisions, read my post on Search Engine Land.
Our assumptions/things to be aware of
We are assuming that search volume represents interest. So if “H&M dresses” is searched 1,000 times and “Zara dresses” is searched 5,000 times we assume that there is more interest in “Zara dresses”.
Higher interest doesn’t necessarily mean more people want to buy something. There could have been a news story about dresses spontaneously combusting. When we get this data, we then need to gather context and interpret it.
The broad approach
When we run ads in Google Ads, we get data.
We get number of impressions. This is just a count of how many times people have seen our ads.
We also get impression share (IS). To calculate impression share – Google looks at our targeting criteria, calculates the total number of times we could have been seen. Then Google then tells us what proportion of the time we were actually seen.
Estimating search volume
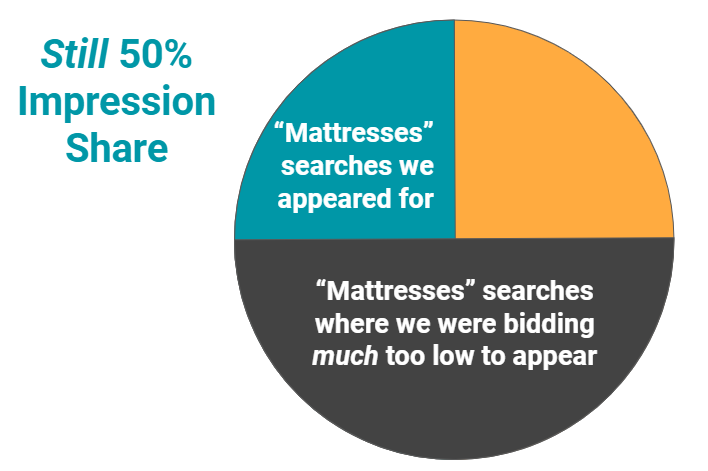
For example, say we bid on the keyword “mattresses” in Seattle for a month. If, during that month, there are 2,000 searches for “mattresses” in Seattle, and our ads were seen 1,000 times, our impression share will be 50%.
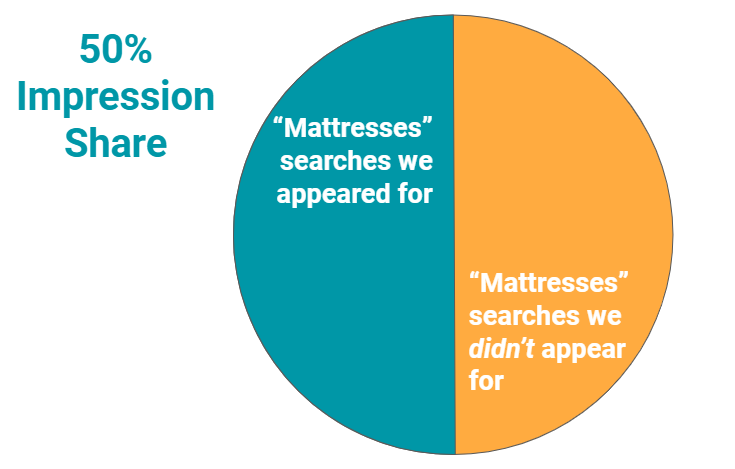
Google doesn’t give us the total number of searches, but it gives us the Impression and Impression Share numbers and we can just reverse the calculation.
Impression Share = Impressions / total searches
total searches = Impressions / Impression Share
If you have qualms about trusting Impression Share check out the “More details about the process” section at the end of this post.
Targeting our searches
To get city-level, product-level brand strength insight we need city-level, product-level targeting.
Targeting location
Location targeting is set at campaign level in Google Ads. So for each city we want to get data for, we need to set up a campaign targeting only that city.
To properly compare results between cities, each campaign must be identical aside from the city targeting.

You can target multiple cities, that’s a good technique if search volumes tend to be quite low. But you won’t be able to tell the difference between interest in City A and interest in City B.
Targeting products
To estimate interest in specific products for specific brands, we just bid on searches that contain both brand plus product. So for example, we’ll bid on;
- “H&M dresses”
- “Zara dresses”
- “Uniqlo dresses”
- “Asos dresses”
- “H&M maternity”
- “Asos bikini”
- “Uniqlo jeans”
How do we make sure our ads are relevant for all of these brands?
This is where we need to break out of the classic PPC mindset a bit. Bidding on other people’s brands is expensive if we want to take their traffic. But what if we don’t want their traffic?
Bidding on other people’s brands is EXPENSIVE if we want to take their traffic. But what if we don’t want their traffic? Then it’s a great source of brand data. https://bit.ly/2ZFlR60
Tweet
If I wanted to bid on “Zara sale” with therobinlord.com that would be very expensive. My site isn’t relevant, it’s not a good result. Even if I had a site that sells maternity clothing, it still wouldn’t be relevant to searches specifically for “Zara sale” because it’s not Zara.
The only page we can guarantee will be totally relevant for “Zara sale” searches is Zara’s sale page.
So when I bid on “Zara sale” in my experiment, I drove that traffic straight to Zara. My ads were a bit better than the one below, but you get the picture.

I did the same with every keyword – found the most relevant brand page to send traffic to and sent it there.
Most of the time these brands weren’t bidding on these searches. I have no reason to take any traffic away from them. Because I’m sending people straight to a super relevant branded page I can make sure I’ll consistently appear in the auction without having to bid really high.
In fact, this research cost me around 3p per keyword, per day.
This approach also helps us work within Google Ads’ rules. If we used “Zara sale” in our ad copy but didn’t send people through to a Zara page, Google would stop us from running the ad. It would be a misuse of Zara’s brand name to promise Zara but send people somewhere else. This way, if people click Zara – they get Zara.
Setup summary
- A campaign for each territory we’re targeting
- An ad group for each brand we’re targeting
- A keyword for each brand+product combination we want data for
- Each keyword sends users through to the most relevant page on the brand’s own site.
Example data and actions
I have focused on the fashion industry here deliberately because I am not an expert in fashion. If I can get this information in my spare time for brands I don’t work with, you can do way more with your companies and clients.
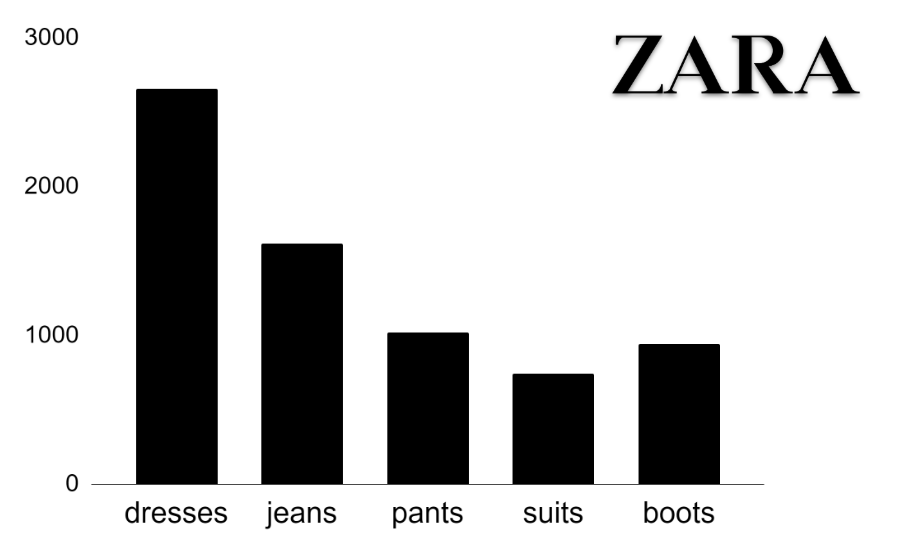
Zara’s high product-specific searches (and what that could mean for UX)
The graph below shows the number of searches for “Zara dresses”, “Zara jeans”, “Zara pants”, “Zara suits” and “Zara boots” in Seattle, Vancouver, LA, and Portland during February 2020. I researched more terms but the graph starts to get hard to read.
This graph below shows us the number of searches for these Zara products in comparison with searches for competitors products i.e. “H&M dresses”.
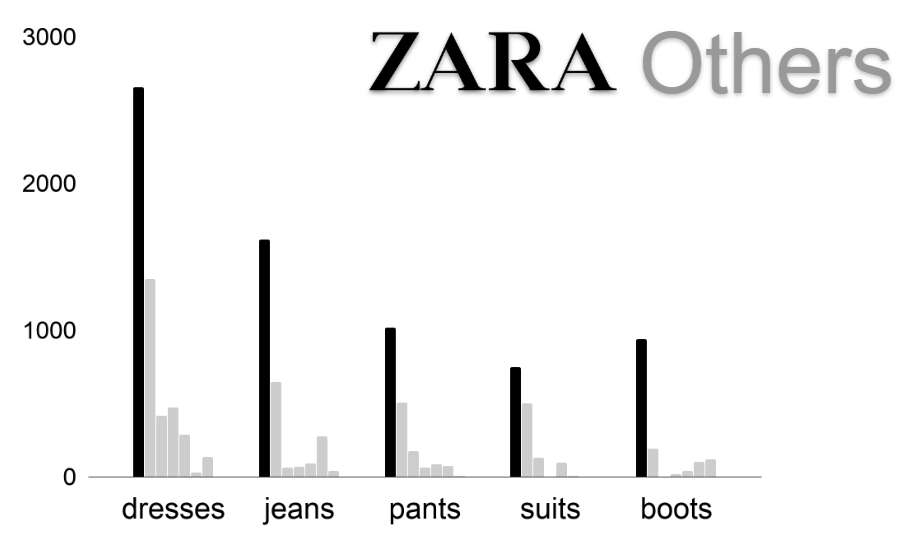
Now we have a direct, product-level comparison of brand strength in Seattle, Vancouver, LA and Portland. Because we’re dealing with actual search volumes, we can also see which topics are more valuable (spoiler, it’s usually dresses).
We’ll get into more specific brand comparisons later. For now I want us to focus on one fact. Zara is doing way better for product searches than other competitors in our data.
However if we put “Zara” into Google Trends, along with the same competitors we can see that interest in Zara is pretty high, but they aren’t absolutely demolishing everyone else.
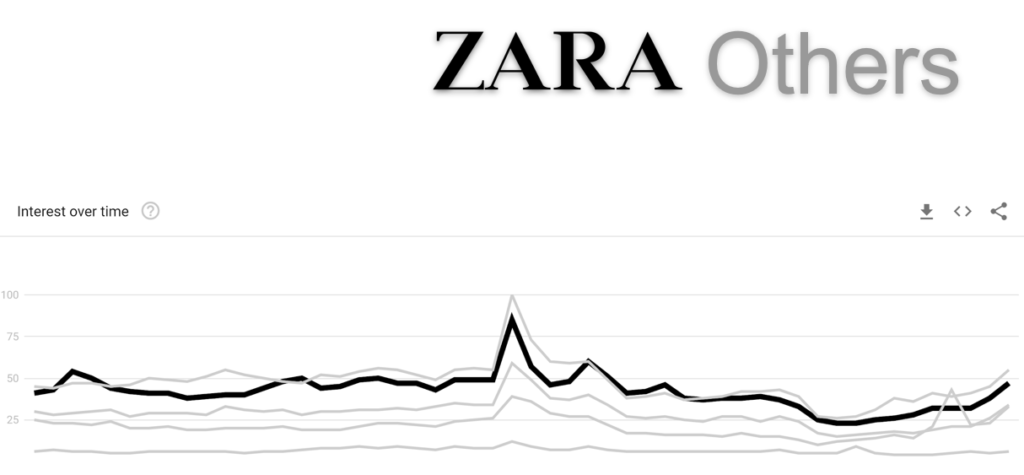
So, if it looks like general interest for Zara is roughly in-line with these competitors
What could be making people search for Zara+product so much more than everyone else?
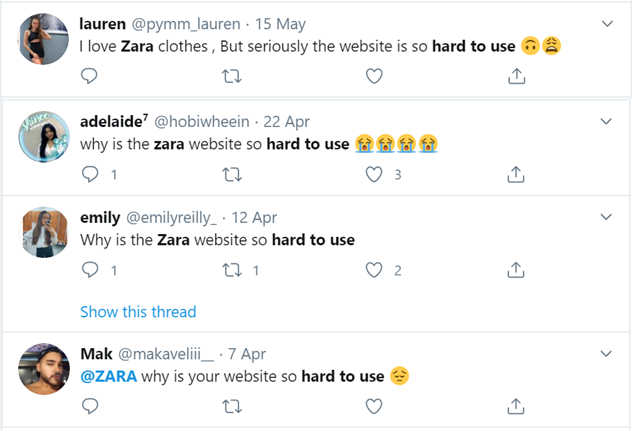
I started to look at Zara more closely and one thing that came up a lot is that the Zara site can actually be quite hard to use.
We can see if that’s a common opinion by using Twitter advanced search to see if people are often saying the same thing.
So what might be happening here is;
- A user is on the Zara site, they want to buy a dress
- They find the site quite difficult to navigate
- Instead they go to Google and search “Zara dresses”
- Google finds the page, they land on it
- Everything’s great.
But there are a few problems here.
Driving customers to competitors
First, if this is the case, it could be causing users to spend time in Google that they would otherwise be spending on the Zara site.
If users are just using Google as navigation and Zara bids on brand terms then Zara could be losing money on purchases that would have happened anyway.
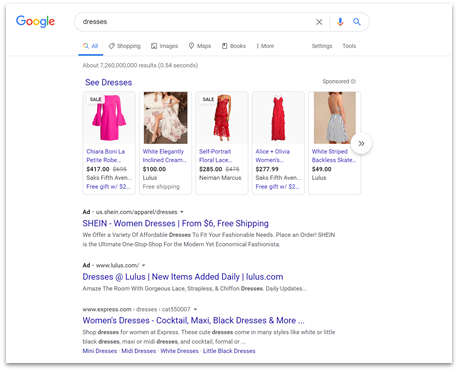
What’s more, Google is a place where many sites are advertising dresses. These users may be coming from a frustrating user experience with Zara. They could just go straight to a competitor. In and of itself that’s lost sales.
Sending bad signals to Google
Depending on what signals you think Google pays attention to, this could also be hurting search rankings. Google could be seeing users landing on the Zara site and then quickly coming back to search results after a bad experience, in order to go elsewhere.
It’s controversial whether that kind of signal impacts rankings. That said, in 2018 CNBC sat in on a meeting where search engineers reviewed an algorithm change. Here’s a direct quote;
“The team ran through various data points, like what percent of users clicked through a picture-link and then quickly clicked back (a bad sign), or whether there was a significant increase in the time until they made their first interaction with the results (also bad).”
CNBC
So Google is using that kind of data somewhere. We also know that Google will be bringing in more and more user signals to future algorithm updates.
So poor UX could cost us rankings now, could cost us rankings later. Either way – it’s almost certainly going to cost us sales now so it’s something for us to pay attention to.
What action can we take?
It’s not a new idea to use data from our own on-site search to work out what users are struggling to find. This just takes that concept and applies it to the biggest search engine in the world. We can see how users are using Google to interact with our site and see if it’s drastically different to how they interact with our competitors’ sites.
If we see that our overall brand interest is roughly in line with competitors but our product specific brand interest is way higher – that’s a sign that we might need to look at our UX.
Surveys and UX tests
Based on this data, Zara could run surveys on users who are leaving the site without making a purchase to find out what they struggled with.
In fact, Zara could select category pages which don’t rank for any popular search terms and run surveys on those pages, targeting users who have come direct from Google.
Zara could also use Twitter advanced search to find users who are complaining about the site being hard to use and reach out to those people asking what could be improved.
Why not offer incentives for those Twitter users to get involved? These are people who are already telling followers that they shop at Zara. They care enough about the Zara brand that it matters to them when the site is hard to use. If we get them involved, they may well start talking about that too. That’s free, grass roots, social media promotion for our improved UX.
SEO and CRO
Finally, by improving our UX we might improve our rankings. Either way, it’s quite likely that an improved UX will improve our sales which makes everyone look good (particularly the people who found this data).

Zara maternity
I promised you product-level brand comparisons so here we go.
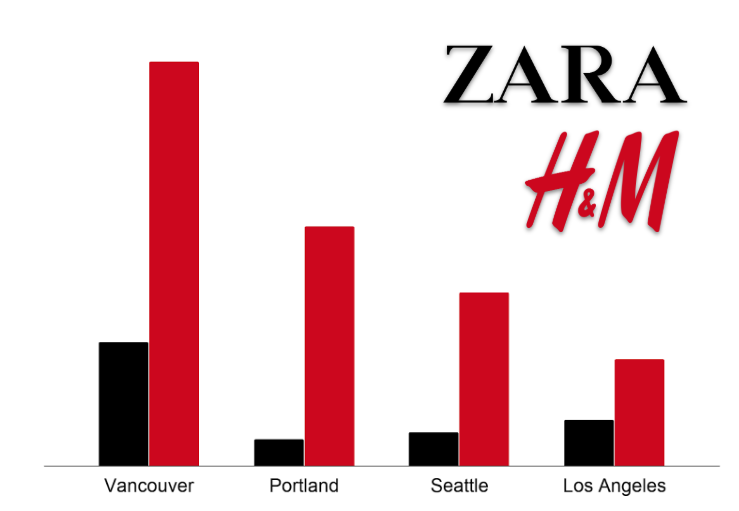
The graph below shows total number of searches for brand+product combinations across LA, Vancouver, Seattle, and Portland in February 2020. Zara is in black, H&M is in red. So “Zara jeans” vs “H&M jeans”, “Zara boots” vs “H&M boots”.
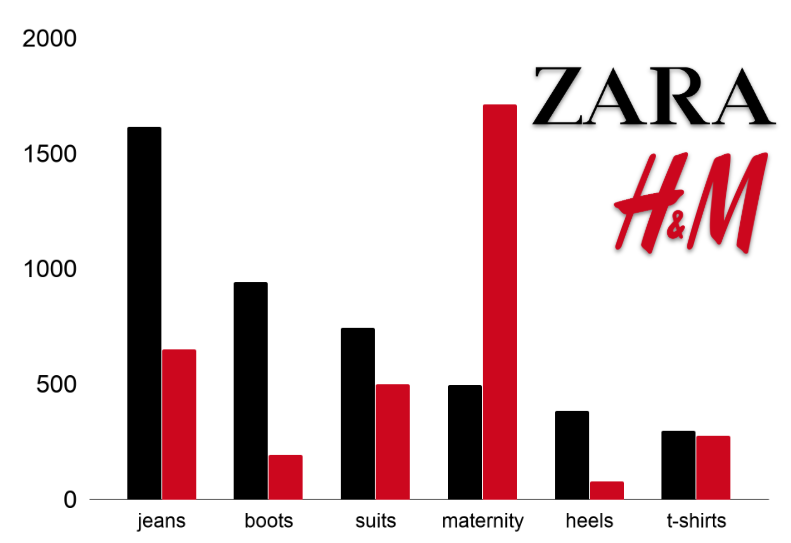
As before, Zara is in the lead pretty much across-the-board. But not in our maternity category. There are way more “H&M maternity” searches than there are “Zara maternity” searches.
When I first told people this, their general response was;
“Yea? Zara doesn’t really do maternity”
Everyone I asked
Maybe it’s not surprising that people don’t search for “Zara maternity” if it’s not something that Zara does.
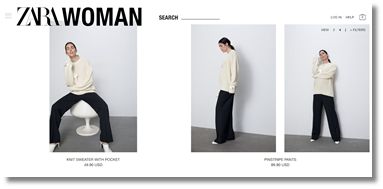
However, I’m willing to bet someone at Zara would disagree. Because zara.com has a maternity category with over 206 products. So even if it’s not a business priority, Zara has invested something in maternity clothing.
Funnily enough, when I searched “Zara blog”, the top result was the “Zara” category on this woman’s blog. She’s writing about maternity fashion and talks about how Zara’s (non-maternity) dresses are a great option.
So there’s opportunity here, people just don’t associate Zara with maternity clothing as much as they could do.

Getting more territory-specific information
If we know that Zara could be doing better in terms of maternity awareness, that gives us something to go on. But it’s still a lot of work to change the opinions of the entirety of West Cost America on a topic.
The more targeted we can be with our activity, the more effective it will be so let’s break our data down further.
The below graph shows relative search interest for “Zara maternity” and “H&M maternity” in each of our cities.
Now we’re not looking total search volume because LA is so much bigger it’s likely to always have the highest search volumes. Instead we’re looking at number of searches proportional to city size. I’ve removed the y-axis because it’s just confusing and not informative here – what matters are the proportions.
For information about estimating per-capita searches, see the adjusting for city size section at the end of this post.
The proportional search interest suggests that both Zara and H&M are doing best in Vancouver. Perhaps that’s a sign that these brands are particularly popular with expectant families in Vancouver, or perhaps Zara should look at birth rates in Vancouver in comparison with these other cities.
H&M is doing second best in Portland, where Zara is actually doing worst. Perhaps Zara also focuses on Portland as an area where they seem to be missing out the most.
What action can we take?
PR/Outreach
Zara could focus on reaching out to Mom-bloggers and influencers. They could particularly focus on ones based in Vancouver and Portland to drive up awareness in those key cities.
SEO and PPC
Zara can use that activity to drive links (and perhaps wider press interest too) that could help improve their organic rankings. They could also overbid on “maternity” PPC terms.
This is important – by ranking for “maternity” terms in organic and paid search we aren’t just driving sessions now – we’re making it clear to our audience that we are an option for maternity products. So we’re not just getting direct conversions – we’re getting sessions which create more branded sessions down the road.
Even if the return on investment is low to begin with, it will get better in the longer run.
By ranking for product searches in paid and organic we’re driving some sessions now but we’re also building our brand and making our audience think about us as an option in future. It’s worth it even if short term ROI is low https://bit.ly/2ZFlR60
Tweet

J.Crew plus size
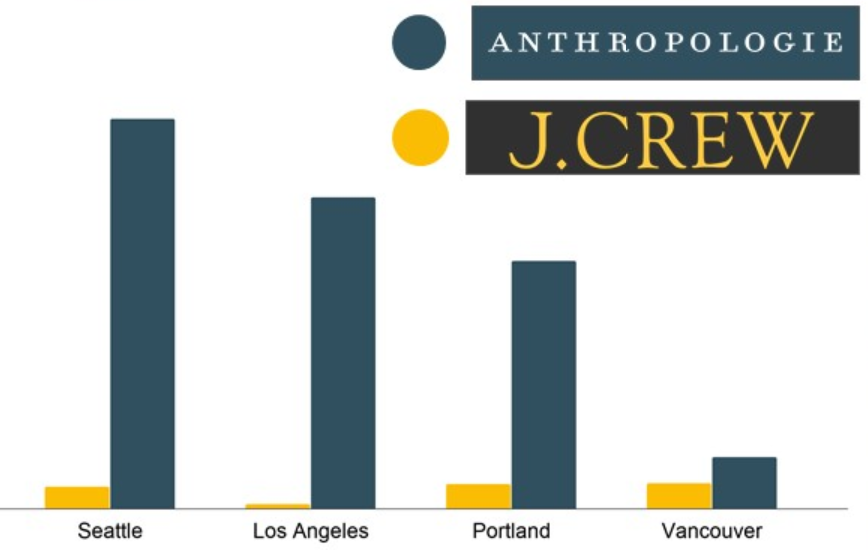
As our final example, let’s compare Anthropologie and J.Crew.
J.Crew vs Anthropologie comparison
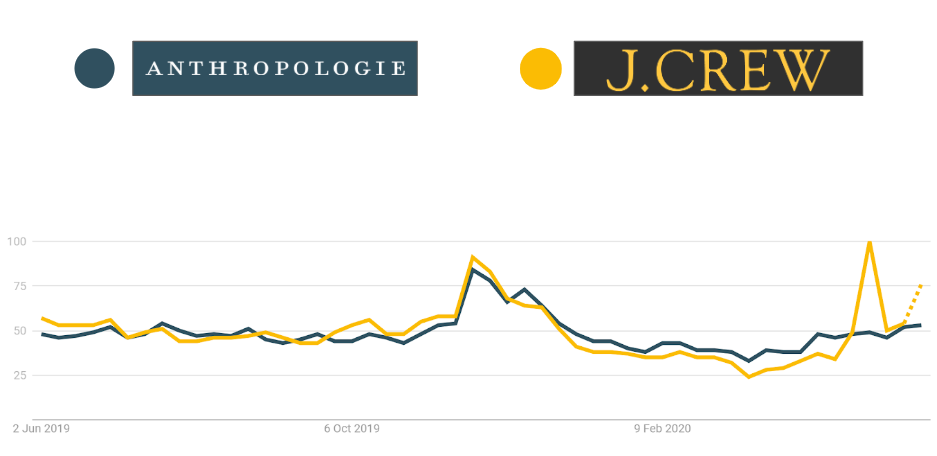
Overall brand interest for the two brands is roughly equivalent if we put them into Google Trends (I’m telling you, Google Trends is a great source of brand insight).
On a product-by-product basis, it’s kind of a mixed bag. Sometimes “Anthropologie+product” is more popular, sometimes “J.Crew+product” is more popular.
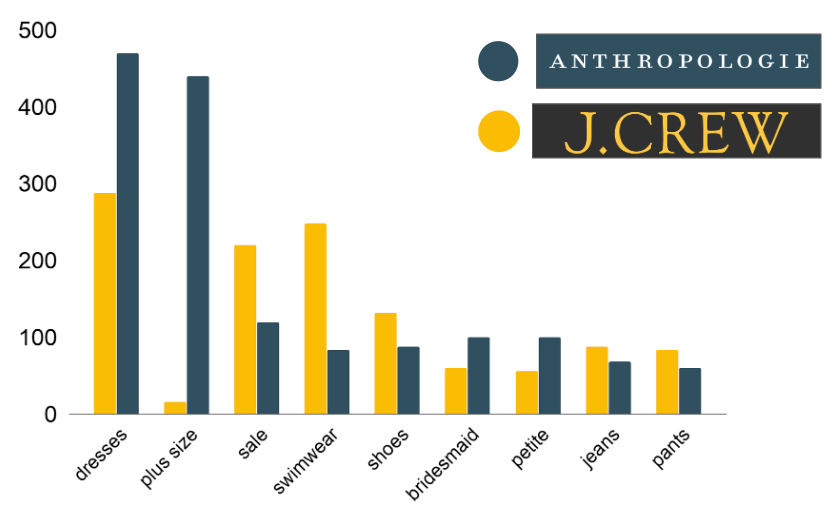
The biggest difference between the two is for “plus size” searches. There are way more searches for “Anthropologie plus size” than “J.Crew plus size”.
Anthropologie plus size
To be fair – Anthropologie is actually the #1 brand for plus size searches in our data. And they have invested in the topic.
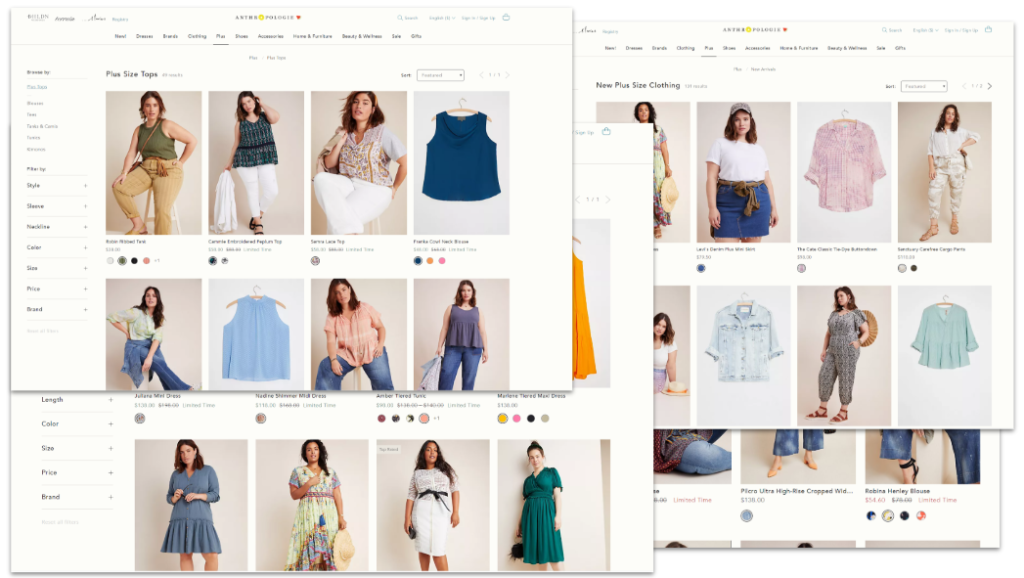
They have a bunch of specific, targeted “plus size” pages to help them rank for the searches. As we said – appearing for searches like “plus size dresses” helps our audience know we’re an option – it’s an investment in future branded conversions as much as it is a way to generate traffic and sales now.
They also often show different body types in their social media messaging.
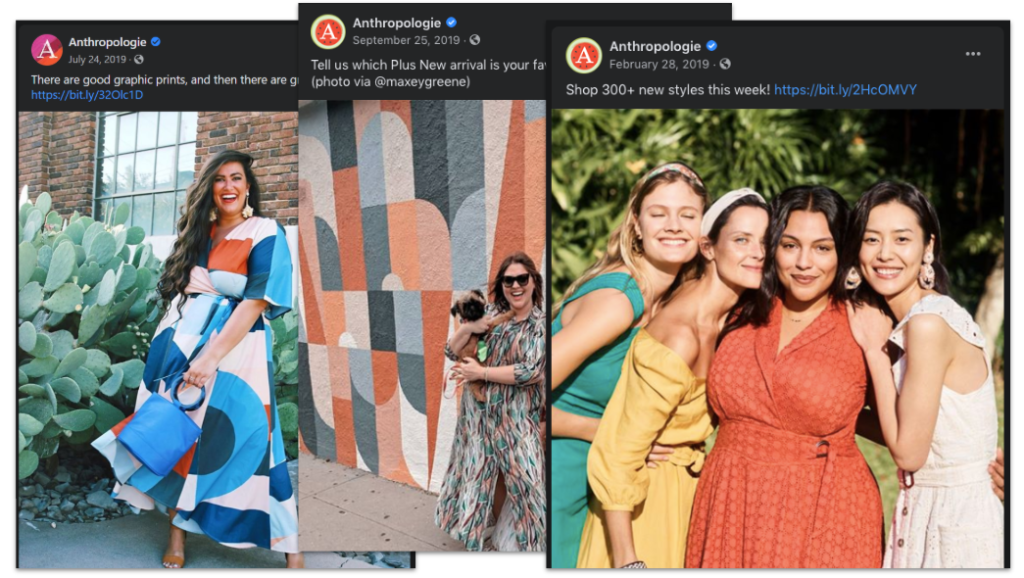
Anthropologie also sponsor events like theCurvyCon, a plus-size fashion conference that runs during New York Fashion Week.

As part of the CurvyCon they had models on the runway and plus size fashion influencers posting about them. @iambeauticurve has 260,000 followers interested in plus size fashion.
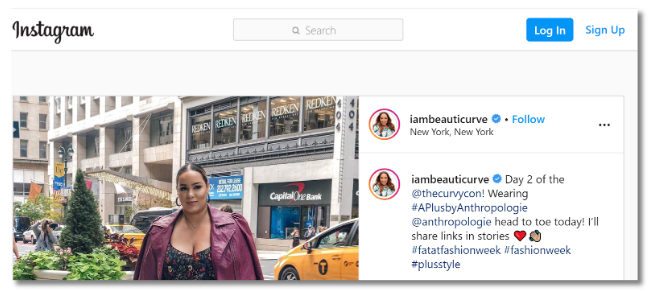
theCurvyCon even got Anthropologie’s plus size clothing line featured on Good Morning America which has an average morning viewership of about 5 million.
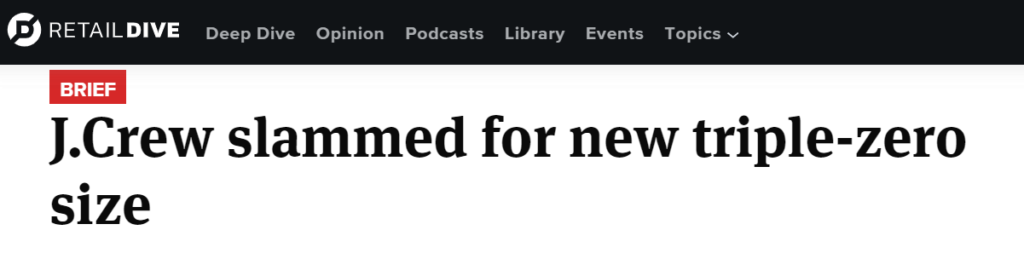
J.Crew plus size
J.Crew’s strength for “plus size” terms is less clear. Historically, they have been criticised for a focus on super-small sizes rather than supporting a variety of body types.
However, more recently J.Crew started to focus much more on supporting different body types.
“Shoppers can expect to see their favorite styles in a wider range of sizes”
Lisa Greenwald, J.Crew’s Chief Merchandising Officer (2018)
Publications like Huffington Post and Forbes hailed J.Crew as a brand “reshaping modern fashion”.
So why were “plus size” searches so low?
J.Crew’s plus size content
J.Crew decided to take an inclusive approach to sizing. Instead of having a separate “plus size” category, they decided to include far more sizing options in their main categories.
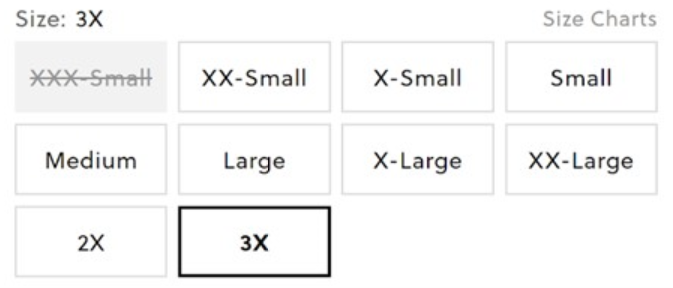
Personally I think that’s great, there’s no reason people should be made to shop in a separate part of the site because of their size.
The problem is, J.Crew was previously known as a brand that doesn’t support larger sizes so they have that history to work against. And the product pages themselves don’t really show that the product caters to a variety of body types.
Searches for “J.Crew plus size”
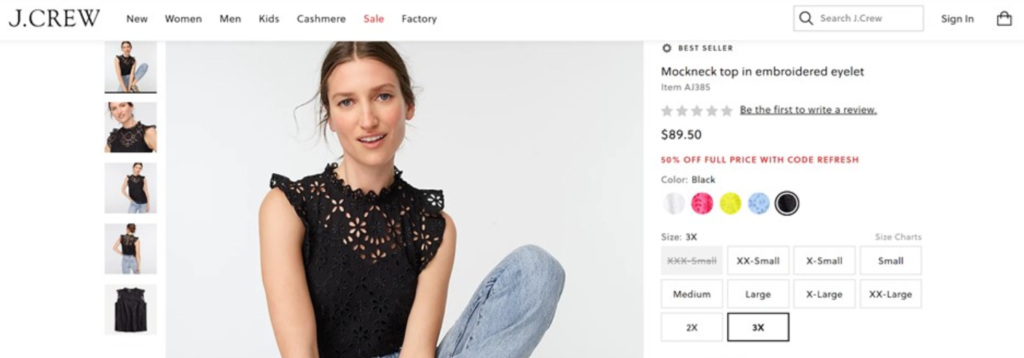
Because J.Crew doesn’t have a separate “plus size” category page, if we search for “J.Crew plus size” we get;
- An ad for the homepage
- Resellers, selling J.Crew clothes
- A J.Crew deals page (not specific to plus-size and now 404)
- People also ask: “does J.Crew do plus size”
If we click on the link to the homepage, the models there also don’t show the variety of body types that J.Crew caters to.
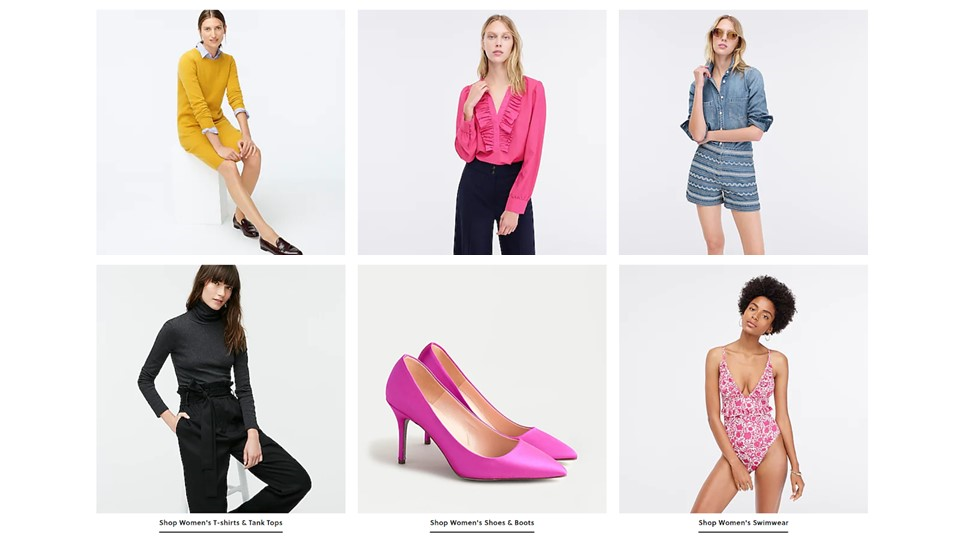
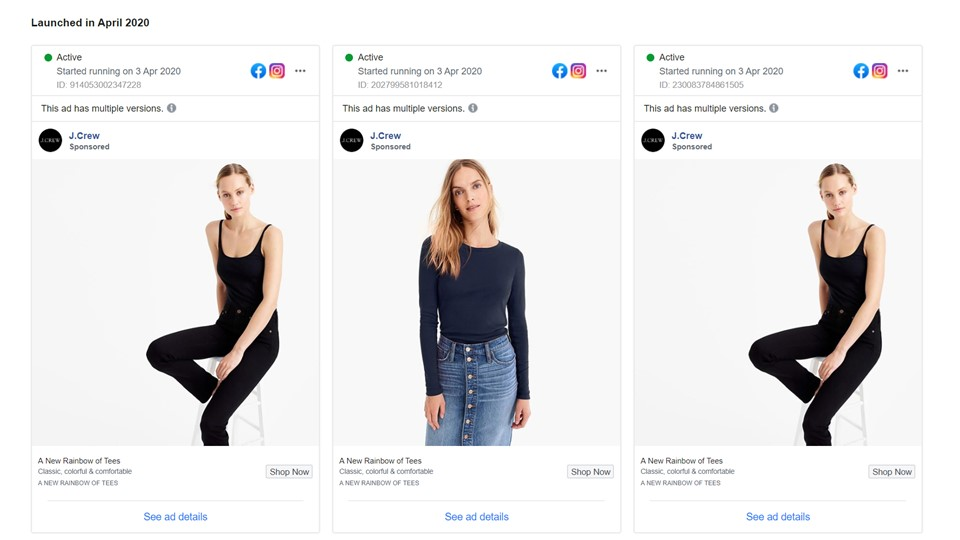
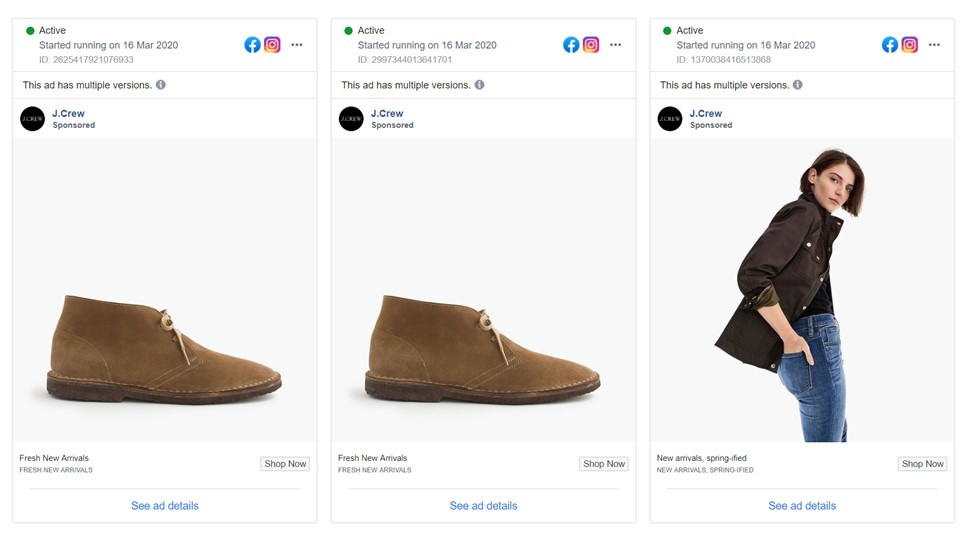
To get an idea of what adverts specific brands are promoting, we can use the Facebook ads library and Twitter ads library. At the time of this research, J.Crew’s social ads also didn’t show a variety of body sizes.
Location targeting
Anthropologie is around a similar price point to J.Crew so we can assume some similarity in audience.
Based on our data, “Anthropologie plus size” is getting the most interest in Seattle and LA. Again – this isn’t raw search volume, this is estimated searches per person. For more information, read the adjusting for city size section at the end of this post.
J.Crew could use this information to start targeting Seattle, LA, and Portland (but perhaps not Vancouver).
What action can we take?
PR/Outreach
J.Crew could target press around Seattle and LA, and sponsor local plus size fashion events or hold events of their own. They could also sponsor theCurvyCon because even though we don’t have data for East Coast America that sounds like a fantastic opportunity for country-wide reach.
Social media
They could decide that Seattle is a key territory to succeed in, and target plus size social posts and adverts specifically to that city. Many of the social platforms offer brand uplift testing options that J.Crew could use to compare short-term impact with changes in branded search.
Having a specific, deliberate target can help drive down costs and can help them run quick experiments to see what has an impact.
ppc
Again, they could overbid on “plus size” terms in the knowledge that they aren’t just generating sessions now – they are helping their audience understand that J.Crew offers plus size clothing.
SEO
Finally, they could create a plus size category page. I think it’s great that they don’t want to make people search in a different section of the site but they could create a plus size page without moving the larger sizes away from the main category.
Our data show that some people are searching for “J.Crew plus size”. At the moment those sessions are probably being taken by resellers who have “plus size” category pages so this is easy organic traffic.
By finding searches for our brand products where we DON’T already have targeted pages we can avoid giving away our sessions to our resellers. https://bit.ly/2ZFlR60
Tweet
Having a plus size category page is an excuse to link to that page from the homepage, so we can get more of a variety of body types shown on the homepage.
With a highly targeted category page, linked to from the homepage, we could start to rank for “plus size” searches. That’s generating sessions and also awareness. J.Crew could even put a big banner at the top saying
Why are you here?
You don’t have to shop in a separate plus size section.
We sell all of our styles in a wide range of sizes. Come to our dresses page.
That could turn a product category page into a brand statement that could get attention and even links from press. Getting press links to the page could help it rank even better generating more sessions, more awareness, more brand strength, more sales.

Conclusion: The power of granular brand data
With this data, we can guide our company on where to put billboards and what to put on them, what press to reach out to, social networks to target, influencers to engage, and emails to send.
We can judge PPC and SEO by completely different, far more strategic metrics and get credit for that hard work.
We can adapt our five year plan to give our customers what they want rather than just what they know us for.
If you’d like a free way to get instant, broad brand interest data, check out my post on getting brand data from Google Trends. In the meantime, I’d love to hear your thoughts about anything you think I’ve missed and I can’t wait to hear what you do with this approach.
Let me know in the comments or tweet me @robinlord8.
Post-script: more detailed guidance
This blog post is quite long enough but here are some general tips and some more detail about the process for if you’re unsure about parts of it.
Tips for setting up and running the campaigns
- If you haven’t used Google Ads much before I really recommend downloading Google Ads manager. It’ll be really helpful when you need to create lots of duplicate campaigns targeting different cities.
- Make sure “Include search partners”, “Include display network”, and “Target expansion” are all disabled
- Don’t use URL tracking templates – we need to set them at keyword level
- In each Ad Group, make sure you are sending traffic through to the brand you are targeting
- Run all of your Campaigns and Ad Groups for the same amount of time (it’s a real headache if you don’t)
- Your keyword targeting needs to be phrase match to have control over what you show for.
- Keep checking your search terms report while you’re running the ads. It’ll show you keywords which your ads are being shown for and it’s even more important here than in a standard campaign. If you start seeing wild things crop up – something has gone wrong and you might need to start again.
- Monitor your Click-Through-Rate – a very low CTR suggests your ad isn’t appearing for what you expect.
- Monitor your Impression Share, you need to get at least 10% to get the more accurate numbers.
- If you are getting a very high impression share (like 80%) test reducing your bid but don’t go too low – if you bid too low you won’t qualify for auction and it’ll look like your impression share is going up (see “Why we can’t use Impression Share for other analyses” below)
We can’t always trust Impression Share for calculating total search volume. One reason is that, as Google says in the documentation, Impression Share isn’t actually based on all searches. Impression Share is calculated from “total eligible impressions”.
“Total eligible impressions” means that if Google thinks our ad could appear for the search but just didn’t, then that search will be included in the Impression Share calculation. However, if Google thinks our ad couldn’t have appeared for the search then that search isn’t included in the calculation.
How could impressions not be eligible?
There are ways in which “eligible impressions” is good and ways in which it is bad.
The good – say we have set our targeting criteria to searches for “mattresses” in Seattle. Someone searches for “mattresses” in Portland, someone else searches for “beds” in Seattle – neither will be included. This is good because the platform is doing what we expect it to. We can use this data to estimate search interest for “mattresses” in Seattle without worrying that those searches will confuse things.
The bad – say someone searches for “mattresses” in Seattle but we are bidding much too low to appear. Google won’t include that search in our Impression Share calculation. Google doesn’t give us a specific cut off for when we’ll start losing data. This is bad because the platform is not doing what we expect it to. We can’t be sure we’re getting an accurate estimate of “mattresses” interest unless we bid really high on really specific mattress terms and usually that’s not worth the money.
Google’s treatment of Impression Share is a problem in our “mattresses” example because it’s quite a broad thing to be bidding on. We’re going to be facing a lot of competition and all of that drives up the required bids.
We also can’t guarantee that we’re perfectly relevant for those searches, being less relevant means we need to bid higher still.
Finally, if we’re trying to work out search volume for something like “mattresses” it’s probably to inform our PPC or SEO activity and work out how much effort we should put into the term. We’re already getting data that’s good enough to inform that kind of activity so it’s not worth spending way more to improve our accuracy.
But in this case we’re focusing on brand insight.
First, that means it makes sense for us to bid on really specific brand searches. So competition is lower and the required bids are lower.
We can also make sure we are really relevant for the search by using brand terms in our ads and sending users through to branded landing pages. So we drive the required bids down even more.
Finally, standard brand analyses are EXPENSIVE – Google ads data is much cheaper so it’s worth spending more than we normally would on ads.
Standard brand analyses are EXPENSIVE – Google ads data is much cheaper so it’s worth spending more than we normally would on ads. https://bit.ly/2ZFlR60
Tweet
Basically we trust Impression Share more by making our ads really relevant, really specific, and bidding higher than we need to, to make sure that all of the searches we want data on are eligible. In some industries this is going to be harder than others but it’s important that we trust our data.
If you don’t think this is going to work for you, check out my post on how to get brand insight from Google Trends. Usually the brands which aren’t able to use this tactic are ones which can get the most out of Trends.
Processing the data we get back
There are a few different ways we can analyse the data we get back;
- Brand + City
- Which brand is doing best in this city
- Which city is the most valuable for this brand
- Brand + Product
- Which brand is best known for this product
- Which products are the most popular for this brand
- City + Product
- Where should I focus on for this product
- Which products should I sell in this city
- City + Product + Brand
- Where a this brand is doing best with this product.
That’s a lot of information – you can’t ask every question at once. I recommend putting all of your data in Google Sheets and creating a Data Studio dashboard just so it’s easier to combine different metrics.
To look at all three dimensions at the same time you’ll need to limit at least one dimension to just a few options. For example where we compare H&M and Zara maternity – that’s all cities for just two brands and just one product.
Adjusting for different city sizes
This process will give us total search volume data, which is great for giving us an idea of return on investment. However, if we’re trying to compare performance in different cities i.e. “this competitor is doing better in LA than in Vancouver” we can’t just use total search volume in those two cities.
There are more people in LA than Vancouver – search volumes are likely to be higher. Maybe we could reach more people with a billboard in LA but costs are likely to be higher as a result. Likewise – if we were to just try running a paid campaign targeting all of LA then that’s going to cost us more than targeting Vancouver.
To work out where we should focus our attention we need to get an idea of how popular a specific brand or product is per person.
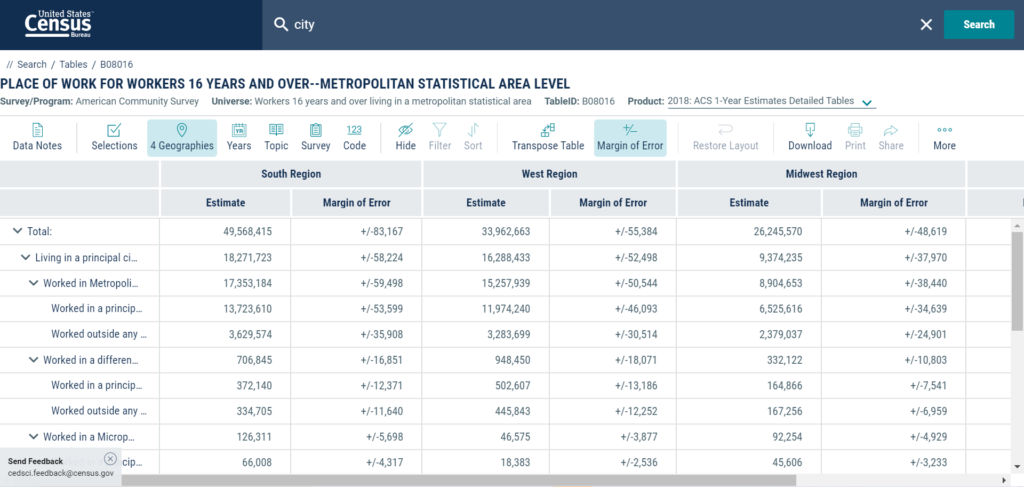
Using census data
Most countries make census data freely accessible (though few have as great an interface as the US census).
If we take our search volume numbers for a given city and divide them by the number of people in that city, based on census data, we can approximate searches per capita.
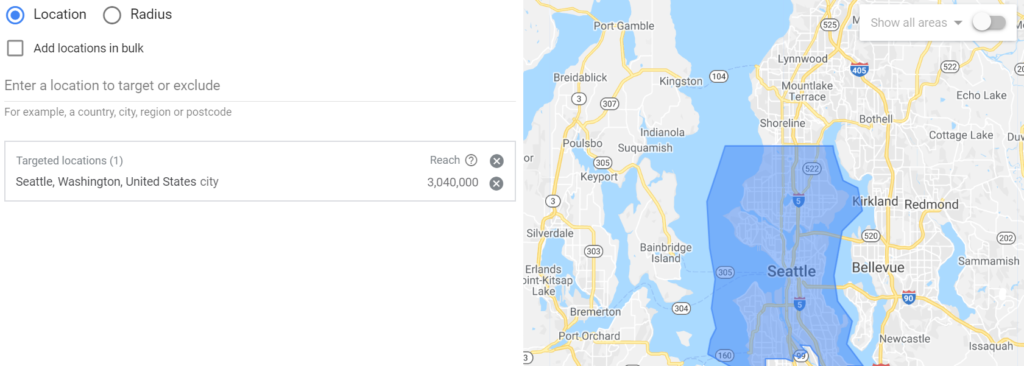
Using Google Ads estimated reach
Another way to estimate interest per person is to use the “reach” estimates Google Ads gives us in the interface when we select a specific territory.
Again, we just take our search volume estimate and divide it by the total number of people we could have reached in a given city.
This can be a good way to go but doesn’t necessarily give us the granularity of census data.
Conclusion
If you’re looking for the conclusion, scroll up.